Overview
The Droopify Dashboard Home is the control center of your business.
From here you can monitor sales, profits, products, and orders in real time, with a fully redesigned structure built to provide instant clarity and actionable data.
Each panel is designed to answer a specific question:
- How much am I selling?
- How much am I actually earning?
- How many products do I have active?
- Where do I need to take action today?
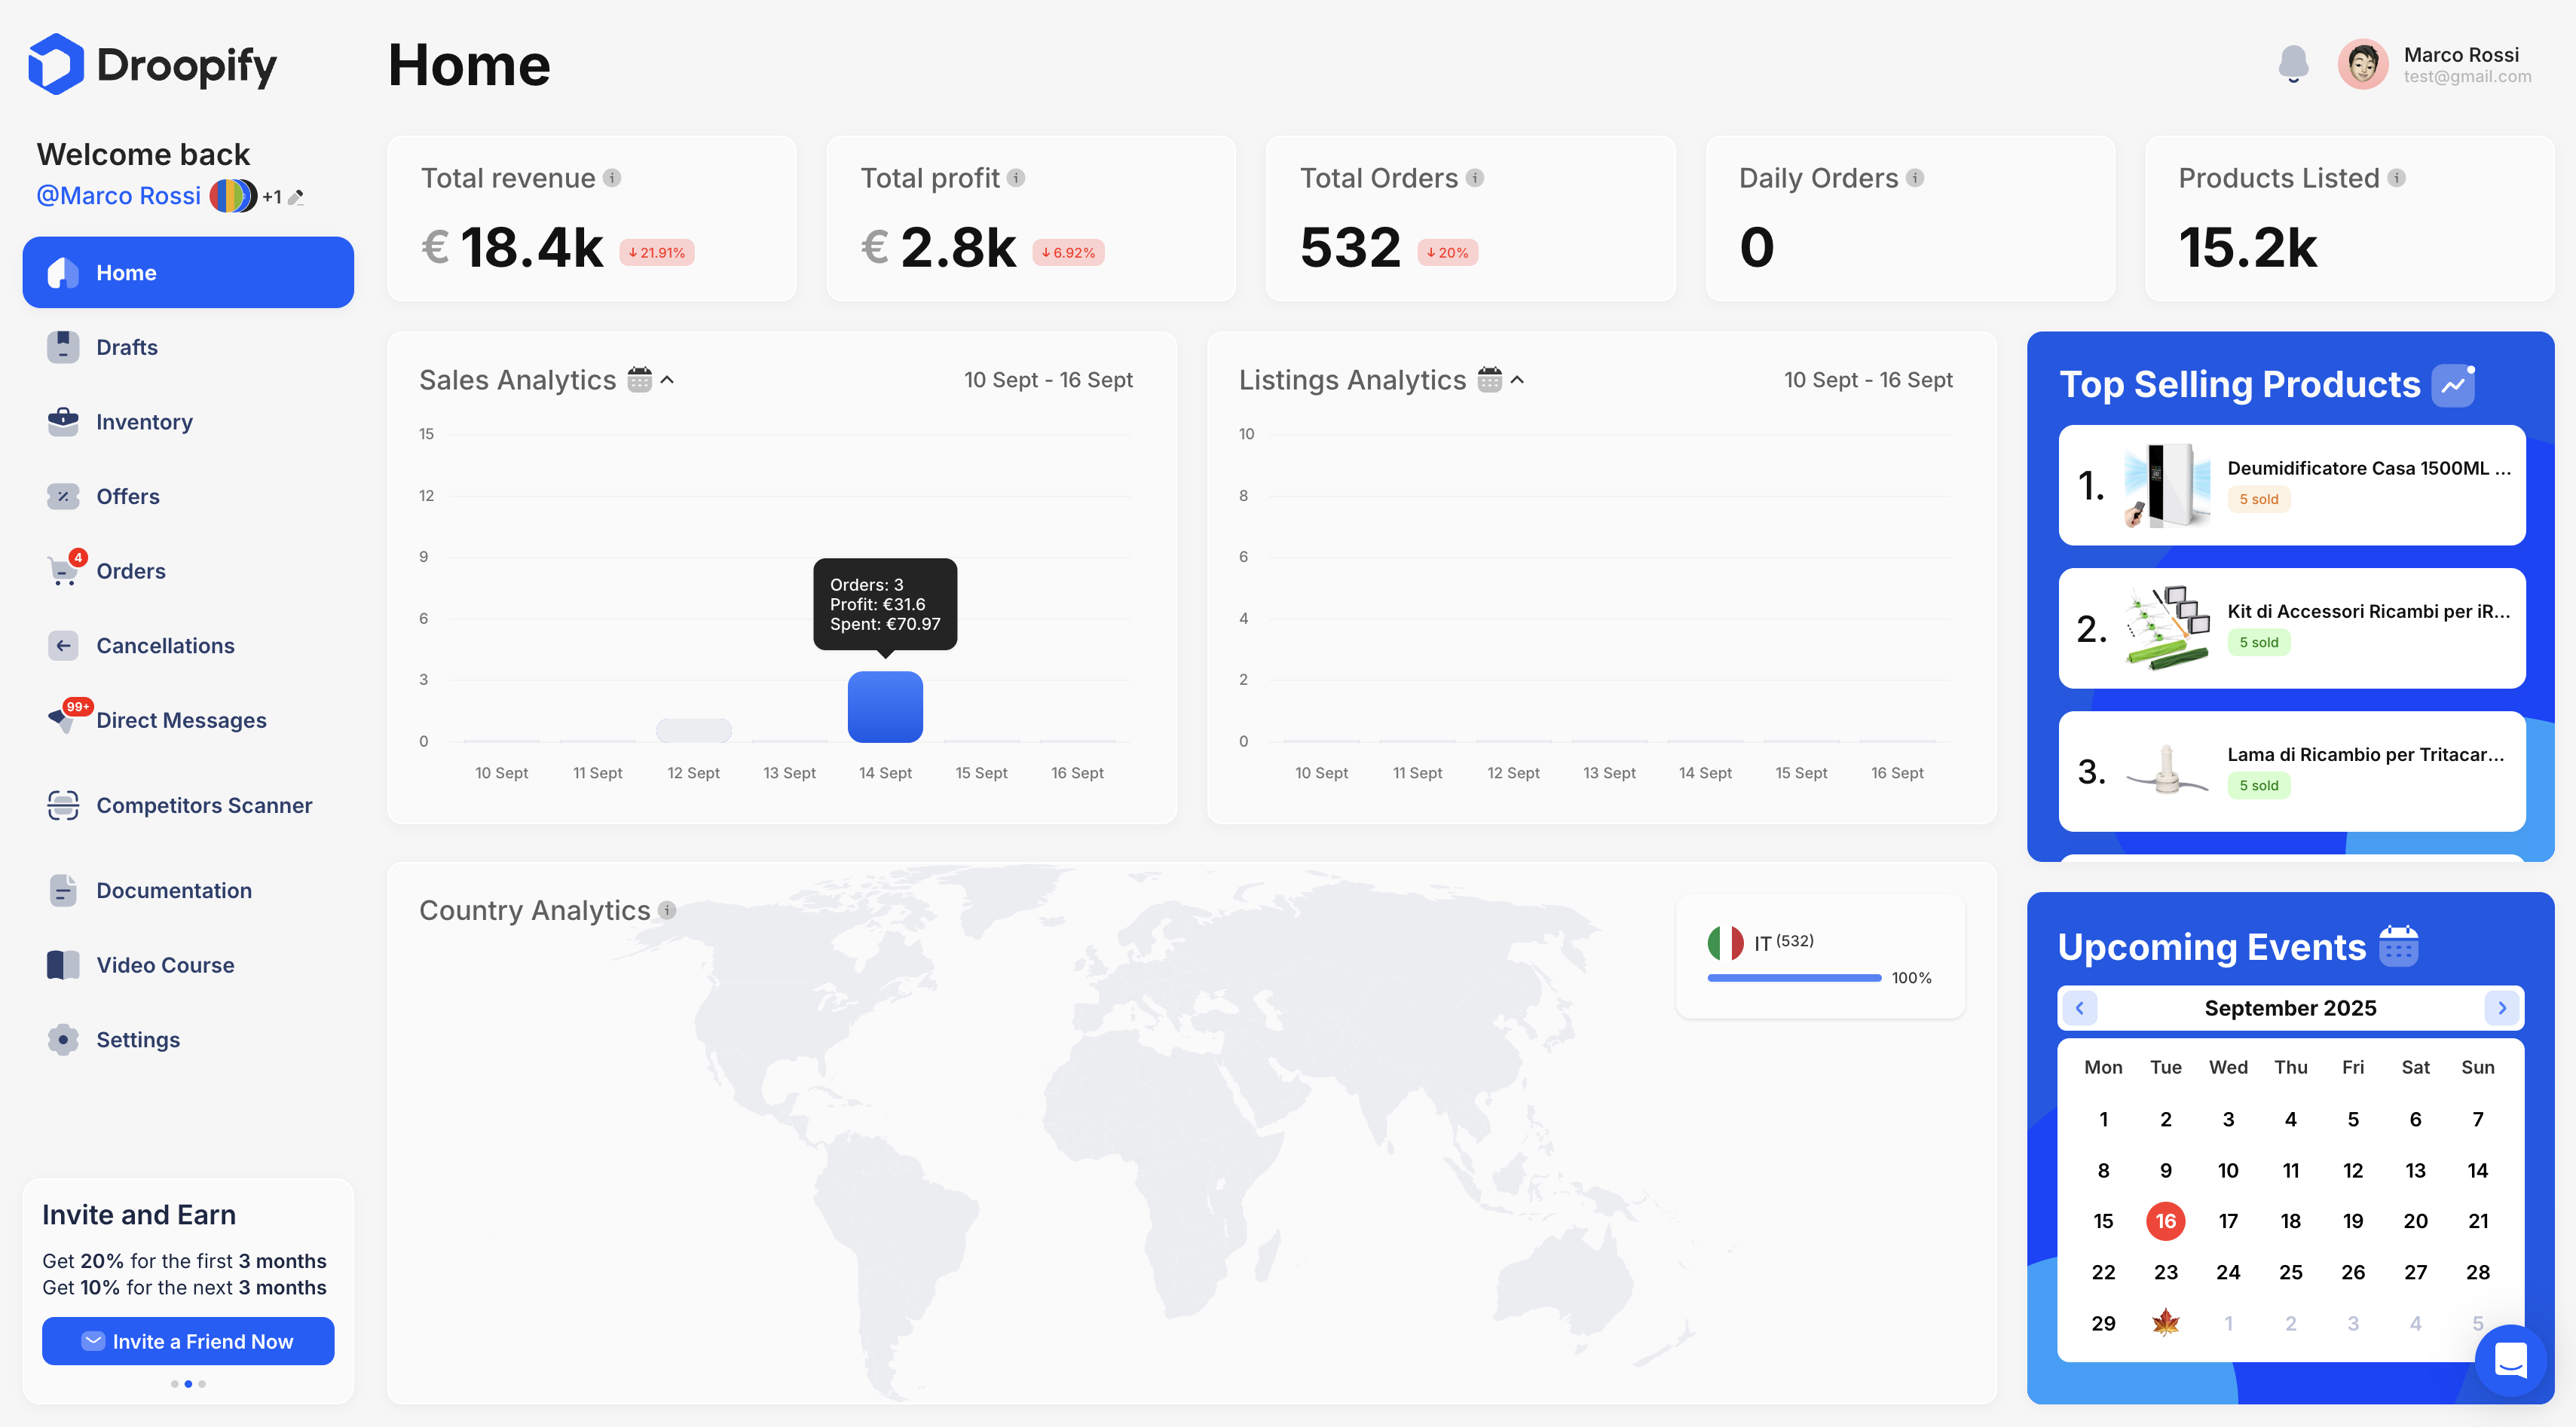
Total Revenue
This panel shows the total sales revenue, meaning the sum of the sale prices of all orders received.
- The main value (e.g. €1.5M) represents the total revenue generated.
- The green or red arrow with percentage indicates the change compared to the last 10 days:
- Upward arrow → revenue growth.
- Downward arrow → decline compared to the previous period.
- The time comparison allows you to immediately understand whether the trend is positive or negative, without analyzing complex charts.
This value is not profit, but the total gross income generated by orders.
Total Profit
Total Profit represents the actual net earnings generated from sales.
Important details:
- Profit already excludes all eBay fees.
- It does not include:
- Droopify subscription
- eBay store subscription
- Any other external costs
Here you’ll also find:
- The main net profit value.
- A percentage indicator (green or red arrow) showing performance compared to the last 10 days, useful to understand whether profitability is improving or worsening.
This is the key panel for evaluating the real financial health of your business.
Total Products
This panel shows the total number of products in Droopify, including:
- Products in Drafts
- Products in Inventory
Key details:
- Each variant counts as a single product
Example:- 1 listing with 5 variants = 5 products
- The number therefore represents the true size of your catalog
Product Trend Chart
Below the total number, there is a line chart showing:
- The number of new products imported into Droopify each day
- The evolution of listings over time
By hovering over a point on the chart, you can see:
- Specific date
- Number of listings imported that day
This panel is ideal for understanding how much and how consistently you are scaling your catalog.
Total Orders
The Orders panel shows:
- The total number of orders received
- The breakdown by market (e.g. Italy, Germany, Spain, France)
The central pie chart provides an immediate overview of total volume, while the side list indicates:
- How many orders come from each country
This helps you:
- Understand which markets are performing best
- Identify opportunities for geographic expansion
Commercial Events Calendar
The calendar on the right:
- Highlights the current date
- Shows relevant commercial events and holidays
⚠️ Important note
This calendar is not used to change the date range of the data shown on the Home.
Its purpose is to:
- Help you prepare your catalog in advance
- Plan products and listings related to:
- Holidays (Christmas, Valentine’s Day, Black Friday, etc.)
- Seasonal or commercial events
It is a strategic tool, not an analytical one.
Sales Overview
The Sales Overview is a bar chart showing order trends over time.
Key features:
- Each bar represents a single day
- Hovering over a bar shows:
- Daily revenue
- Daily profit
- Expenses
- Total number of orders
Select Dates
In the top-right corner you’ll find the “Select Dates” button:
- Opens a calendar
- Allows you to choose a custom date range
- All Home data will update based on the selected range
This panel is ideal for:
- Weekly or monthly analysis
- Comparing different periods
- Identifying particularly profitable or critical days
Ongoing Orders
This panel shows the status of orders that are not yet completed.
Central Number
The number at the center of the chart represents:
- All orders that do not have the status “Delivered” or “Canceled”
Breakdown by Status
Below the chart you’ll find the breakdown by status:
- Pending → orders to be fulfilled
- Ordered → orders already purchased from the supplier
- Shipped → orders in transit
- Supplier Error → orders with issues (e.g. canceled by Amazon)
This panel is highly operational:
- It tells you immediately what you need to do
- Highlights problems that require manual intervention
- Reduces the risk of stuck or forgotten orders
Monthly Views
Monthly Views indicate how many times your eBay listings have been visited in the last 30 days.
What they represent:
- Each time a user opens your listing
- They don’t guarantee interaction, but indicate interest
An increase in views suggests:
- More attractive listings
- Better positioning in eBay search results
Here too, you’ll find the percentage variation compared to the last 10 days.
Monthly Impressions
Monthly Impressions represent how many times your listings were shown to users, even if they were not clicked.
Key difference:
- Impressions → appearance in eBay search results
- Views → actual opening of the listing
Impressions are essential for evaluating:
- Listing SEO
- Titles, images, and price competitiveness
- Overall catalog visibility
A high number of impressions with few views suggests you can improve titles, images, or pricing.
Conclusion
The new Droopify Home is designed to:
- Give you immediate control
- Reduce analysis time
- Turn data into fast decisions
Each panel is not just informative, but designed to guide your daily actions and help you scale your business consciously and profitably.